Japanese respondents reported using gift cards for themselves more often than giving them to others in a new Researto survey, while a separate group of social-gifting services showed the reverse pattern. [S01]
The research, first published October 7, asked 800 residents aged 20 to 59 about experience with 10 services selected by the researcher. It divided them into two groups of five. Within the gift-card group, 28.3% reported self-use and 16.3% reported giving a gift; for social gifting, the figures were 17.4% and 22.8%, respectively.
A use case difference within a selected sample
Reported gifting and self-use differ by service group
Share of all 800 respondents who reported either experience with at least one of five researcher-selected services in each group.
% of respondents
Tap or hover for details. Select a series above to show or hide it.
Source
Online survey conducted October 2-3, 2026, among 800 Japanese residents aged 20-59. Multiple answers were allowed. Each category combines any of five selected services; the two groups are not exhaustive market definitions. No demographic weighting was applied.
Show data tableHide data table
| Category | Given to another person | Used for oneself |
|---|---|---|
| Social-gifting services | 22.8 % of respondents | 17.4 % of respondents |
| Gift-card services | 16.3 % of respondents | 28.3 % of respondents |
The comparison separates two jobs that can sit inside the same gifting category: transferring a benefit to someone else and using prepaid value for personal purchases. It does not establish why respondents chose a service, how often they used it or how much they spent.
For programme operators, that distinction changes how the figures can be read. Reported use is broader than consumer-to-consumer gifting. Counting all use as gifting would therefore overstate the behaviour the survey actually measured.
What the survey can establish
Researto, operated by Interview Room Co., Ltd., conducted the online study October 2-3 through the QiQUMO panel. The sample contained 400 men and 400 women, with equal age quotas. The researcher says it did not weight responses to match the population’s age and sex distribution. [S01]
The survey’s overall figures also depend on the question being asked: 73% recognised at least one of the 10 selected service names, while 54% reported any use. That broader use measure includes giving, receiving, including company campaign rewards, or using a service for oneself. It should not be substituted for the narrower gifting measures. [S01]
Awareness and any use have the same all-respondent base
Researto’s rounded overall measures for the 10 selected services among the same 800 respondents. Any use includes giving, receiving or self-use.
% of respondents
Tap or hover for details. All values are also available in the data table.
Source
Online fieldwork October 2-3, 2026, ages 20-59 in Japan; no population weighting. Whole percentages are the researcher’s rounded text figures. Any use includes receipt through company campaigns as well as gifting and self-use. These nested measures cannot be added and are neither national market penetration nor a conversion rate. The service list was selected by the researcher.
Show data tableHide data table
| Category | Share of all respondents |
|---|---|
| Know at least one selected service | 73 % of respondents |
| Have used at least one selected service | 54 % of respondents |
Respondents could select more than one type of experience. The figures consequently cannot be added together as mutually exclusive customer segments. They also describe experience with the chosen services, rather than the Japanese population’s gift-card penetration or the share of purchases going to each format.
The study offers a snapshot of reported behaviour at one point in time. It provides no earlier comparable wave that would establish growth, and the researcher explicitly says the work does not test causality. The original publication date is retained here; a subsequent press release and October 13 update do not make it a new study.
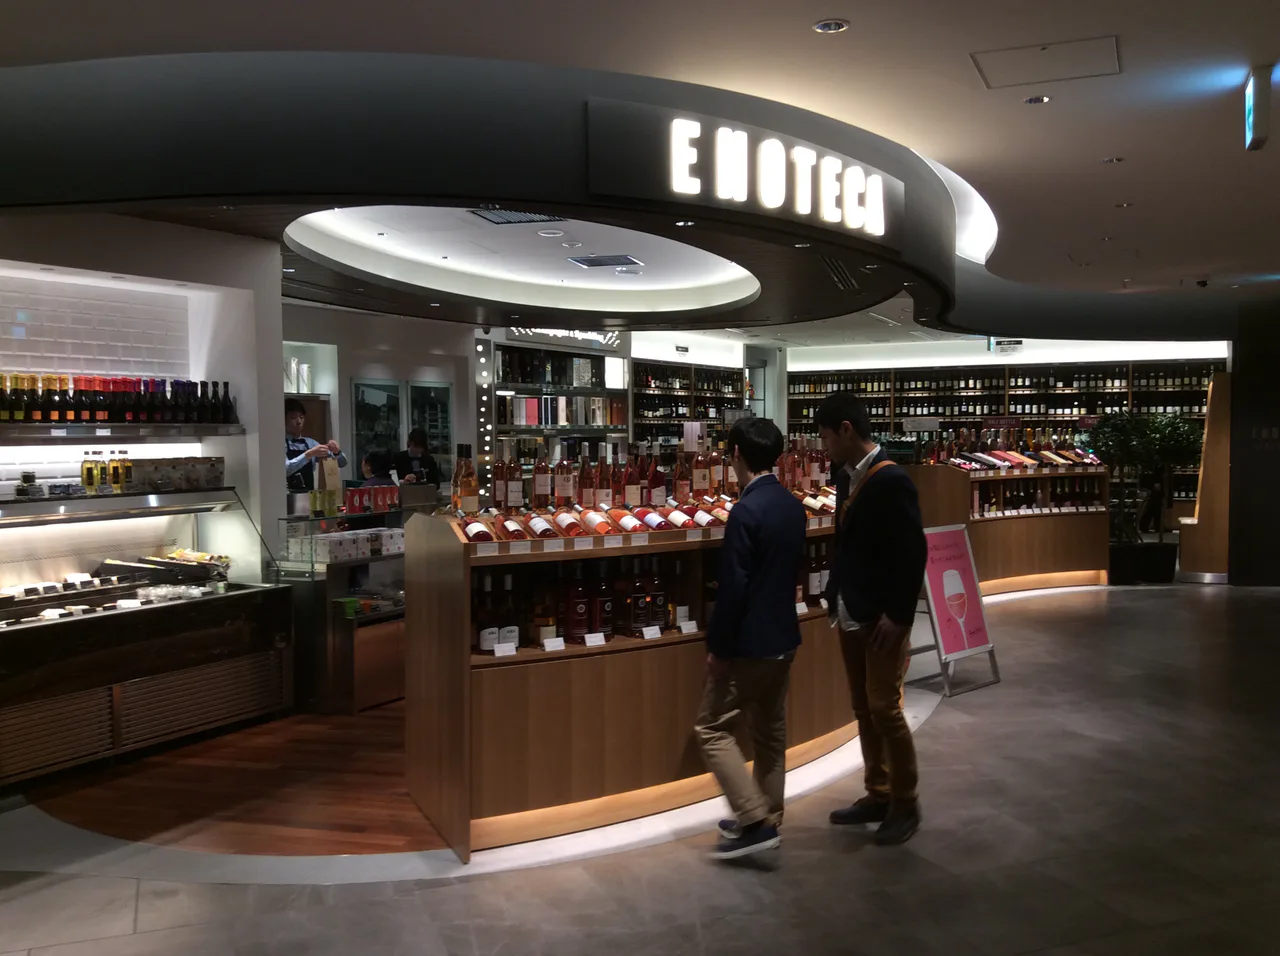
Photograph: a wine shop at Ginza Six, Tokyo, photographed April 27, 2017. Archival retail context, not the Researto survey, its respondents or data collection; no retailer involvement is implied. 江戸村のとくぞう, GINZA SIX13.jpg / Wikimedia Commons, CC BY-SA 4.0. Resized and cropped; image adaptations and derived social image retain the same licence.
In this article

Maya Bennett
Maya Bennett covers customer loyalty, employee rewards and incentive programmes for Gift Card News.