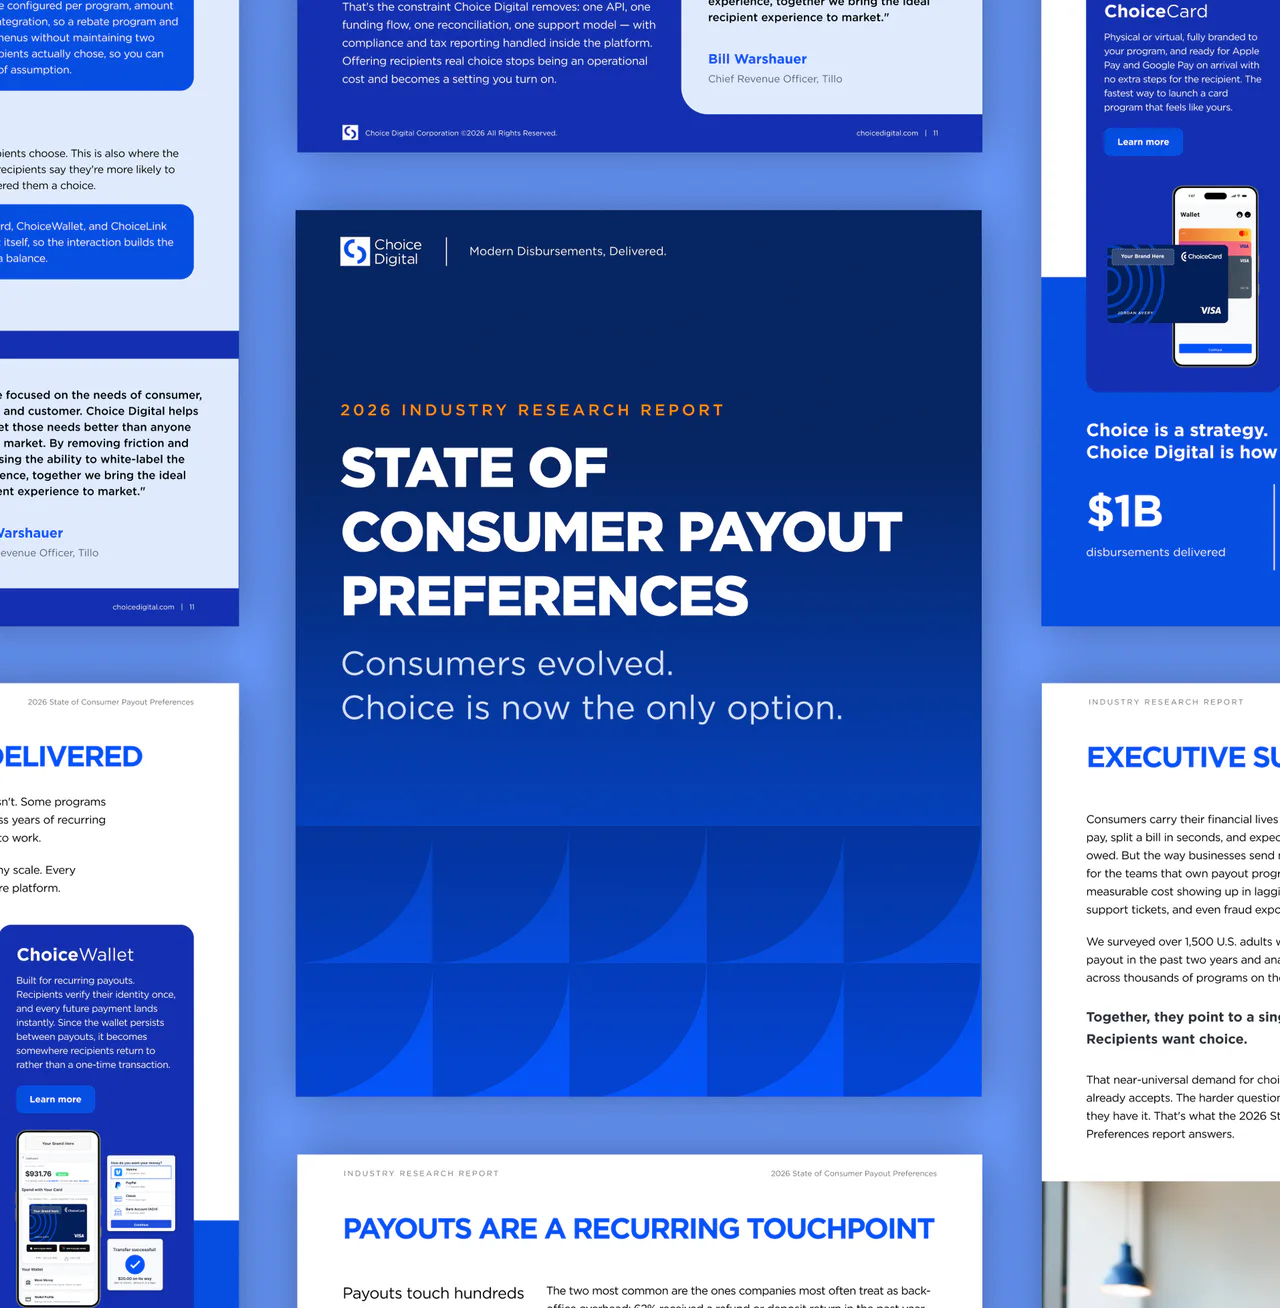
Giving someone a reward is only part of the job. The way the recipient receives it can affect whether the experience feels useful, expensive or difficult. Choice Digital's 2026 consumer payout research, announced on August 17, puts numbers around that distinction: 94% of respondents said a choice of payout method was important.
The study is especially relevant to gift card and incentive operators because it treats the payment menu as part of the recipient experience. Yet the headline is not a measure of demand for merchant gift cards. A person who wants choice may ultimately choose a prepaid card, a transfer or another available method.
The company's research announcement [S01] describes a national survey of 1,567 U.S. adults, together with observed redemption patterns across thousands of live programs. Those are separate sources of evidence. Survey percentages describe reported attitudes; platform observations describe behavior within the programs included in that analysis.
Choice matters, but it sits beside fees and protection
The public infographic reports five factors rated very or extremely important. No-fee options lead at 88%, followed by fraud protection at 85%. Choice of payment type reaches 79%, customer service access 75% and speed 72%.
What recipients rate very or extremely important
Five payout factors, using the same reported importance threshold.
%
Tap or hover for details. All values are also available in the data table.
Company-sponsored survey. The release reports 1,567 U.S. adults overall; the public infographic does not provide the respondent base for each question. Multiple factors may be important to the same person, so these percentages must not be added.
Explore the data table
| Category | Share of respondents |
|---|---|
| No-fee options | 88% |
| Fraud protection | 85% |
| Choice of payment type | 79% |
| Customer service access | 75% |
| Speed of receipt | 72% |
The 79% figure for payment choice and the 94% headline should remain separate. The chart uses the narrower very-or-extremely-important threshold; the headline describes choice as important more broadly. Presenting them as two measurements of the same response would obscure that difference.
For a program manager, the practical point is that a longer menu is not the whole proposition. Recipients also need to understand the cost, trust the delivery process and know how to obtain help. A selection screen that creates uncertainty about those basics can leave the most relevant questions unanswered.
Stated intent is useful, but it is not measured retention
The infographic also reports positive expectations about companies offering payout choice. These findings come from distinct questions: satisfaction with the company, willingness to engage again, and likelihood of taking part in a promotion or rebate.
Reported responses to companies offering payout choice
Three separate questions about expected satisfaction and future engagement.
%
Tap or hover for details. All values are also available in the data table.
Self-reported attitudes from separate questions, not measured retention or conversion rates. The promotion/rebate result combines somewhat and much more likely responses. Public material does not disclose question-level respondent bases.
Explore the data table
| Category | Share of respondents |
|---|---|
| Satisfied or very satisfied | 82% |
| More likely to engage again | 74% |
| More likely to join a promotion or rebate | 68% |
These results give operators a reason to examine the payout experience. They do not show that introducing a choice menu will raise an individual program's repeat use by 74%, or that 68% of recipients will complete a future promotion. A stated likelihood and a recorded action are different measures.
What the gift card figures can actually tell us
The release reports a gift card selection share of 67% in programs without a digital wallet option and 36% where a wallet option was present. This is a comparison between observed program conditions, not a documented before-and-after experiment on the same recipients.
| Reported observation | What is established | What should not be inferred |
|---|---|---|
| 67% gift card selection without a digital wallet option; 36% with one | Choice Digital reports different selection shares under different observed program conditions. | That adding a wallet caused the difference, or that all gift card programs would experience it. |
| 47% in a combined card preference category | The infographic groups prepaid cards, gift cards and push-to-card in one category. | That 47% of respondents prefer merchant gift cards alone. |
| Survey sample of 1,567 U.S. adults | This is the overall survey size stated in the announcement. | That it is the denominator for the platform selection figures or every individual question. |
The public material does not give the size of the program groups, their participant mix or controls for differences in available rewards. The useful signal is that menu context deserves attention. The figures do not establish how much of the observed difference comes from the wallet option itself.
For a gift card distributor, that suggests a concrete reporting question: was a lower selection share accompanied by fewer gift card selections in absolute terms, or did the overall payout pool change? A percentage alone cannot answer that. Nor can a broad card category show which merchant brands recipients selected.
Timing and fees can pull in different directions
The infographic says 47% would experience some or significant financial strain from a two-week delay. It also reports that 32% would pay a fee for instant digital delivery instead of waiting two weeks for a check.
Willingness to pay for that specific alternative does not cancel the importance of a no-fee option. The questions describe different trade-offs. A recipient can prefer a free route and still be willing to pay when the proposed alternative is a long wait. Program teams should therefore explain both the cost and the delivery time rather than assume one preference settles the other.
How to read the evidence
The charts above use Choice Digital's publicly downloadable three-page 2026 infographic [S02], alongside its August 17 announcement. The company is both the research publisher and a provider of the payout services discussed.
These public materials identify the overall U.S. survey sample but do not set out fieldwork dates, recruitment, weighting, full question wording, question-level bases or confidence intervals. They also do not provide enough detail to treat the separate platform observations as a controlled experiment. The findings are therefore best used as directional evidence and as questions to examine within a program's own reporting.
The clearest lesson for the gift card industry is to measure the experience surrounding the reward. Method choice, costs, support and access to funds all deserve attention. Keeping those measures distinct makes it easier to tell whether a recipient wanted a different reward or simply encountered a difficult route to receiving it.
Sources and documents
Collapse
- [S01] Research announcement, August 17, 2026 — Choice Digital
- [S02] 2026 consumer payout preferences infographic, three pages — Choice Digital
- [S03] 2026 State of Consumer Payout Preferences research landing page — Choice Digital
In this article

Oliver Reed
Oliver Reed covers industry acquisitions, investment and market research for Gift Card News.