The US gift card market is approaching a quarter of a trillion dollars in annual value, according to PayNXT360's January 2026 forecast. For issuing partners, retailers and distributors, however, that headline is only the starting point. The commercial opportunity depends on who buys the card, where its balance can be spent, how the recipient receives it and which company earns revenue from the transaction.
Gift Card News' analysis of published market estimates, consumer research, incentive-program surveys and financial disclosures finds three developments shaping the market: more consumers are using gift cards for their own spending, digital distribution is becoming closely connected to redemption and loyalty, and employers remain a distinct source of demand. Physical cards continue to matter across this increasingly digital system.
The evidence also points to a practical constraint. A large value of cards sold does not automatically produce a large revenue pool for a new provider. Merchant discounts, processing costs, service obligations, fraud losses and the division of responsibilities between partners determine the economics of each program.
How large is the US gift card market in 2026?
The Q1 2026 edition of PayNXT360's US gift card databook, published by ResearchAndMarkets, estimates market value at $230.48 billion in 2025 and forecasts $246.91 billion for 2026. Its 2030 forecast is $320.81 billion, with a stated compound annual growth rate of 6.8% over 2026–2030. These are commercial research estimates and forecasts, rather than a government statistical series or completed 2026 sales results.
US gift card market: estimate and forecast
Annual market value, including consumer and corporate gift cards; January 2026 report edition.
USD billions
Tap or hover for details. All values are also available in the data table.
2025 is an estimated historical value; 2026 and 2030 are forecasts. These figures measure gift card market value, not issuer or distributor revenue. The three columns are selected report years, not a continuous annual series.
Explore the data table
| Category | Market value |
|---|---|
| 2025 estimate | 230.48 USD billions |
| 2026 forecast | 246.91 USD billions |
| 2030 forecast | 320.81 USD billions |
The forecast adds $73.90 billion between 2026 and 2030. That is a useful indication of scale, but it is not revenue available to a processor or distributor. The report covers consumer and corporate demand and both open-loop and closed-loop gift cards; an individual provider serves only the products, customers and territories covered by its agreements. The publisher's accompanying announcement confirms that the headline values are expressed in billions of US dollars.
A separate figure illustrates why market definitions matter. NRF expected shoppers to spend $29 billion on gift cards during the 2025 winter holiday season, with 43% planning to buy at least one. This is seasonal consumer purchasing intention, rather than the same annual retail-and-corporate market measured by the databook. It should neither replace nor be added to the annual estimate.
Issuing, processing and distribution are different businesses
Two distinctions help partners interpret the opportunity. Closed-loop gift cards are redeemable with a specified brand or group of brands. Open-loop gift cards use a payment network, such as Visa or Mastercard, subject to the applicable card terms. Separately, a card can be physical or digital. A digital format does not, by itself, identify the issuer or determine the acceptance network.
For a business selecting a gift card partner, the important question is which responsibilities the proposed contract actually covers. Issuance and responsibility for the stored value, transaction processing, access to retailer inventory, card distribution and management of an employer's rewards program are different functions. A provider offering an API or a large brand catalog should be assessed against those functions, rather than assumed to perform all of them.
This division also changes the relevant market calculation. A distributor may earn from negotiated commercial terms and service fees; a retailer evaluates redemption and merchandise margin; a program platform may charge for administration or integration. Card face value is a measure of value moving through the system, not a substitute for any of those revenue measures.
Self-use brings gift cards into everyday spending
Blackhawk Network's 2026 research offers a clear signal that gift card demand extends beyond presents. In its January survey of 2,138 US adults, 77% planned to buy gift cards during 2026. The proportion planning to buy them for personal use as part of a spending strategy rose from 31% in 2025 to 56% in 2026: an increase of 25 percentage points in stated intention. BHN also reported that 18% had bought gift cards with loyalty points, up four percentage points from 2024.
More consumers plan to use gift cards for their own budgets
Share planning to buy gift cards for self-use as part of a spending strategy.
%
Tap or hover for details. All values are also available in the data table.
BHN reports a 25-percentage-point increase in stated intention. The 2026 US study surveyed 2,138 adults in January 2026; the comparison does not measure completed sales or a 25% relative increase.
Explore the data table
| Category | Self-use purchase intention |
|---|---|
| 2025 | 31% |
| 2026 | 56% |
Fiserv's separate Q4 2025 survey found that 77% of respondents considered budgeting easier with gift cards, while 63% said they used their cards in less than a month. These results describe respondents' behavior and opinions; they do not establish that gift cards improve every household's finances.
For retailers and rewards providers, the commercial implication is a broader purchase occasion. A product designed only around birthdays and December gifting can overlook customers seeking a particular brand, a loyalty redemption or a way to organize near-term spending. Balance visibility, clear redemption instructions and a useful selection of everyday merchants become part of the proposition.
Digital gift cards grow while physical cards retain a role
Fiserv's 2025 annual survey, fielded in November and published in April 2026, reported a 68% preference for digital rather than physical gift cards, compared with 66% in 2024. Its reported redemption-channel split was 56% through mobile apps, 24% in stores and 19% on websites. Those findings come from a survey of more than 1,000 US consumers; they are not a transaction-weighted estimate of digital gift cards' share of market value.
BHN's January 2026 study, in contrast, described physical cards as the preferred format overall, while almost a third of respondents wanted both physical and digital options. Different samples, questions and fieldwork periods can produce different preferences. Combining the percentages into a single national digital-share estimate would conceal those differences.
TSG and Bank of America's survey of 1,002 US adults, conducted on February 5–10, 2026, provides another view: 36% reported buying only physical gift cards in 2025, 27% bought both formats and 13% bought only digital cards. These three groups are not a complete 100% allocation of all respondents.
Physical and digital gift cards coexist
Gift card formats respondents said they purchased during 2025.
%
Tap or hover for details. All values are also available in the data table.
Survey of 1,002 US adults, February 5–10, 2026. These categories total 76% and are not a complete distribution of all respondents; percentages measure respondents rather than sales value.
Explore the data table
| Category | Share of respondents |
|---|---|
| Physical only | 36% |
| Physical and digital | 27% |
| Digital only | 13% |
Delivery preferences also matter. In that study, 52% favored email for digital gift card delivery, 25% were comfortable with email or text, 12% favored text and 11% chose neither. Digital distribution therefore requires more than an SMS-only journey. A buyer, recipient and redeemer may use different channels, and the experience needs to connect them.
Brand availability matters across store and online channels
InComm's review of more than 6,500 recent gift card shoppers surveyed during 2025 found a 20% year-over-year increase in the number of closed-loop shoppers who went online when they could not find the desired card in a store. It also reported a 23.5% increase in the average number of digital gift cards purchased. The sample required a gift card purchase within the previous 90 days, so it represents recent purchasers rather than all US adults. InComm's 2025 shopper review
For a retailer, an unavailable brand can therefore become a lost distribution opportunity. For an online provider, the same situation can create a customer acquisition opportunity. The operational question is whether advertised inventory is actually available at the required denomination and can be delivered reliably. Catalog size alone gives an incomplete answer.
Employer rewards create a separate B2B buying case
The TSG and Bank of America study found that 81% of consumers would like gift cards from an employer, while 41% had received one. The 40-percentage-point gap signals interest, but it does not measure employer budgets or predict how much additional spending will occur.
Employer gift cards: interest exceeds reported receipt
Two questions from the 2026 US consumer gift card study.
%
Tap or hover for details. All values are also available in the data table.
TSG and Bank of America surveyed 1,002 US adults on February 5–10, 2026. The 40-percentage-point difference is not a measure of employer budgets, a conversion funnel or a forecast of new spending. The two groups may overlap.
Explore the data table
| Category | Share of respondents |
|---|---|
| Would like an employer gift card | 81% |
| Have received an employer gift card | 41% |
The Incentive Research Foundation's 2026 outlook adds the buyer-side perspective. It surveyed 400 industry professionals across North America and Europe in August and September 2025, with 200 responses per region. Among North American programs, gift cards represented 30% of reward allocations, 80% used brand-specific cards and nearly 70% expected gift card use to increase in 2026. These are findings about surveyed incentive programs, not shares of the US gift card market.
The same research found that 84% of North American programs were managed internally and 62% expected their technology budgets to increase. Our reading is that providers have a case for improving an employer's existing operation: ordering, approval, delivery records, reporting and integration with the tools already used by the program team. Replacing the entire rewards strategy is a different sale from supplying cards or making administration easier.
Redemption and repeat visits are stronger measures than face value alone
TSG and Bank of America reported that 55% of consumers would try a new merchant because of a gift card, while 44% typically spent more than the card's value. Both are commercially relevant signals. Neither proves that every redemption creates a new customer or an incremental sale of the same amount.
Younger respondents are more open to trying a new merchant
Share agreeing that a gift card would lead them to try a new business.
%
Tap or hover for details. All values are also available in the data table.
TSG and Bank of America, February 2026 survey. Each percentage uses its own generation as the denominator. These are stated intentions, not measured acquisition or conversion rates; the percentages must not be added.
Explore the data table
| Category | Would try a new merchant |
|---|---|
| Gen Z | 61% |
| Millennials | 64% |
| Gen X | 56% |
| Baby Boomers | 37% |
Their August 2026 guide, based on the same February survey, found that 87% of respondents who received holiday gift cards in 2025 had used at least half of them by February 2026. That describes the share of cards respondents said they had used, rather than 87% of all loaded dollars being redeemed. It should not be counted as an independent second survey.
For merchant economics, we would separate three questions: did the card bring in a customer who would otherwise not have visited, how much contribution margin remained after the offer and servicing costs, and did the customer return? Redemption speed helps evaluate the timing of those outcomes. An uplift in basket size is useful evidence, but the margin on the additional purchase matters more than its headline value.
Unused balances and breakage measure different things
Bankrate's August 2024 survey of 2,373 US adults found that 43% held an unused gift card, gift voucher or store credit. Among the 1,010 respondents with those balances, the average was $244. The figure is conditional on holding an unused balance, not an average across every American. Bankrate's related 2024 holiday report estimated the national stock at $27 billion. Both figures belong to 2024 and include more than gift cards alone.
Unused balances increased in successive survey snapshots
Average unused value among people holding an unused gift card, voucher or store credit.
USD per person
Tap or hover for details. All values are also available in the data table.
Bankrate / YouGov figures are separate annual survey snapshots, not the same people tracked over time. The average excludes people without unused balances and includes vouchers and store credit. These are outstanding stocks, not annual losses or 2026 data.
Explore the data table
| Category | Average per balance holder |
|---|---|
| 2021 | 116 USD per person |
| 2022 | 175 USD per person |
| 2023 | 187 USD per person |
| 2024 | 244 USD per person |
An outstanding balance remains different from a permanently unredeemed balance. It can still be spent, and legal or contractual obligations can remain attached to it. A provider estimating future earnings therefore needs redemption history and the applicable accounting treatment, rather than treating all unused balances as profit.
Starbucks' fiscal 2025 accounts illustrate the distinction. Its consolidated stored-value-card and loyalty-program liability stood at $1.752 billion on September 28, 2025. During that financial year, $15.246 billion was deferred from card activations, reloads and Stars earned, while $15.200 billion was recognized through card and Stars redemptions and breakage. The figures are global and include loyalty points; they are not a US gift card sales series.
Starbucks separately disclosed $200.4 million of breakage revenue in company-operated stores and $22.0 million in licensed stores, totaling $222.4 million. Its policy recognizes expected breakage over time in proportion to redemptions and considers applicable unclaimed-property remittances. This is a company-specific accounting example, rather than an industry breakage rate.
Starbucks recognized $222.4 million of breakage in FY2025
Consolidated global breakage revenue: company-operated and licensed stores combined.
USD millions
Tap or hover for details. All values are also available in the data table.
Company-specific global financial reporting, not the US gift card market or an industry breakage rate. Totals add company-operated and licensed store breakage. The stored-value-card and loyalty liability is a different accounting measure.
Explore the data table
| Category | Total breakage revenue |
|---|---|
| FY2023 | 215.0 USD millions |
| FY2024 | 207.6 USD millions |
| FY2025 | 222.4 USD millions |
Fraud controls and program rules affect distribution economics
The FTC's Consumer Sentinel data for 2024 recorded 41,120 fraud reports identifying gift cards or reload cards as the payment method, with $212 million in reported losses. This combined category and its consumer-reporting basis are important: the figures do not capture every loss, isolate every gift card product or provide a market-wide fraud rate.
For issuing and distribution partners, the practical issue is who handles compromised credentials, suspicious orders, customer claims and escalation when value moves through several parties. Those responsibilities belong in the operating model and commercial assessment, alongside acquisition and processing costs.
Product rules also change the required workflow. Federal Regulation E sets conditions for covered gift certificates, store gift cards and general-use prepaid cards, including minimum protection against expiry of underlying funds and restrictions on inactivity fees. Broadly, funds must remain available for at least five years from issuance or the last load, as applicable; permitted inactivity fees require a year without activity, disclosures and limits on frequency. Exclusions and product-specific conditions matter.
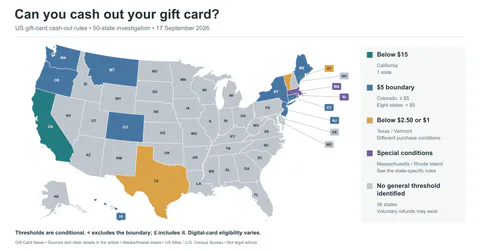
California's SB 22 made a cash-redemption threshold of less than $15 operative on April 1, 2026 for eligible gift certificates, including electronic gift cards, subject to the statute's definitions and exceptions. An exactly $15 balance is outside that particular threshold. For employers, the IRS states that gift certificates redeemable for general merchandise or with cash-equivalent value are taxable rather than excluded as de minimis benefits. These examples show why recipient location, product terms and the purpose of a reward affect program administration.
What issuing and distribution partners should evaluate
Taken together, the research supports a more specific approach to partner selection than comparing the number of brands in a catalog. A retailer selling its own closed-loop balance, a platform distributing third-party brands and a company building an open-loop gift card program have different requirements. Their economics also depend on different contracts.
For an issuing relationship, clarity about the legal issuer, permitted product use and responsibility for balances comes first. For distribution, brand access, denominations, replenishment and commercial terms determine what can actually be sold. For processing and integration, reconciliation, balance information and redemption support determine whether the program can be operated consistently. For a rewards platform, recipient choice must be matched by workable administration and reporting for the buyer.
These are our analytical priorities drawn from the evidence, rather than claims that any named provider offers every capability. The most useful comparison is between the proposed operating models and the costs of serving the intended customer group.
The outlook to 2030 depends on conversion and execution
The PayNXT360 forecast would put annual US gift card value at about $321 billion in 2030. Its scale is consistent with a market serving recurring consumer and corporate uses, but the exact trajectory remains a forecast. The surveys show where demand may develop; they do not establish a guaranteed revenue outcome for an entrant.
The scenario chart shows how sensitive the 2030 value is to the growth assumption. Starting from the same $246.91 billion forecast for 2026, annual growth of 4% would produce $288.85 billion in 2030, while 9% would produce $348.53 billion. These two paths are illustrative calculations. The central path connects the published 2026 and 2030 forecasts through calculated intermediate values.
How growth assumptions change the 2030 market value
Illustrative paths from the published 2026 forecast of $246.91 billion.
USD billions
Tap or hover for details. Select a series above to show or hide it.
The 4% and 9% paths are illustrative assumptions, not external forecasts. The central path uses the published 2026 and 2030 values and a calculated 6.7646% annual rate; 2027–2029 are interpolations. Every 2026 starting value is itself a forecast. Values are nominal US dollars.
Explore the data table
| Category | 4% annual growth illustration | Published endpoints, interpolated | 9% annual growth illustration |
|---|---|---|---|
| 2026 | 246.91 USD billions | 246.91 USD billions | 246.91 USD billions |
| 2027 | 256.79 USD billions | 263.61 USD billions | 269.13 USD billions |
| 2028 | 267.06 USD billions | 281.44 USD billions | 293.35 USD billions |
| 2029 | 277.74 USD billions | 300.48 USD billions | 319.76 USD billions |
| 2030 | 288.85 USD billions | 320.81 USD billions | 348.53 USD billions |
Our conclusion is that the stronger opportunities lie in connecting purchase, delivery and redemption for a defined use case. Self-use can extend demand beyond gifting occasions. Employer programs can create repeat B2B ordering. Better digital experiences can make a broad selection easier to use. Physical distribution remains relevant where customers prefer it.
For partners researching the US gift card market, the key decision is therefore where they can deliver a measurable improvement: reliable access to suitable brands, a clearly defined issuing arrangement, simpler administration, better redemption or lower operating friction. That is a more actionable basis for investment than applying a market-share percentage to the entire value of gift cards.
Research method and data periods
This is original Gift Card News desk research published on September 15, 2026, based on the identified public reports and disclosures. Commercial market sizing uses the report's public summary and the publisher's announcement. We did not conduct the underlying surveys. Market estimates are kept separate from survey percentages, and no average has been calculated across incompatible studies.
The market forecast is the January 2026 edition. Consumer evidence includes 2025 behavior, surveys fielded in late 2025 and early 2026, and explicitly dated 2024 unused-balance and fraud data. The IRF findings cover North America, while the Starbucks financial example is global. Dollar values are nominal US dollars unless stated otherwise. Calculated changes are arithmetic comparisons of the cited figures; they are not additional survey findings.
Sources and documents
Collapse
- US Gift Card Databook, Q1 2026 — PayNXT360 / ResearchAndMarkets
- US gift card report — press release — Research and Markets
- Gift cards gain popularity as top choice for holiday shoppers in 2025 — National Retail Federation
- 2025 Gift Card Year in Review — InComm Payments
- Gift Card Momentum / Defensive Spending — Blackhawk Network
- Gift cards emerge as powerful budgeting tools in 2025 — Fiserv
- 2025 Annual Prepaid Consumer Insights — Fast Facts — Fiserv
- US Consumer Gift Card Study 2026 — TSG + Bank of America
- US Consumer Gift Card Study 2026 — infographic — TSG + Bank of America
- Industry Outlook for 2026 — Incentive Research Foundation
- 2026 Gift Card Guide — TSG + Bank of America
- Gift Cards Survey — Bankrate / YouGov
- Holiday Spending Report — press release — Bankrate
- Fiscal 2025 Annual Report / Form 10-K (pages 74–75; page 57) — Starbucks
- Consumer Sentinel Network Data Book 2024 — Federal Trade Commission
- Regulation E §1005.20 (section 1005.20) — Consumer Financial Protection Bureau
- SB 22 — Gift certificates — California Legislature
- De minimis fringe benefits — Internal Revenue Service
In this article

Oliver Reed
Oliver Reed covers industry acquisitions, investment and market research for Gift Card News.